
Roll the Dice on Learning: Making Probability Come Alive in Your Classroom
- Karen Greenhaus
- Aug 14, 2025
- 3 min read

I recently did a post on probability simulations. I talked about ways to use tables, functions and calculators to simulate rolling dice, or flipping a coin, or picking cards, using the fx-991CW scientific calculator. Probability is such a fun way to explore mathematics, especially when you can collect the data and really relate the concepts of sample size, theoretical probability, experimental probability and measures of center to a real-world application. When I was teaching in the middle and high schools, my students and I had so much fun doing math - i.e. tossing coins, rolling dice, picking cards, using candy to explore sampling, creating surveys and collecting data, etc. Unfortunately, doing probability experiments with real objects can be difficult if you don’t have enough resources for all your students, and also it takes a lot of time to get enough samples, depending on the situation. Having technology and being able to do probability simulations quickly and without the expense of finding the materials, is a great advantage, so today I am going to revisit probability simulations, looking at Casio's newest grapher calculator, the fx-CG100CW, which has a Probability Simulations menu application.

The emulator software for the fx-CG100CW comes with the Probability Simulation menu, which is fantastic, since as a teacher, you could have this on your screen while teaching with students, and run the simulations and students collect and record the data. It would be ideal for students to have the hand-held version as well, since they could run their own simulation experiments. Or, as I used to do, have students do things with the real objects first, and then when needing to do multiple trials, the technology then becomes a tool to expand their data collection quickly.
The Probability Simulator is really powerful because it allows you to quickly collect lots of data, see the changes as data is collected both in a table and graphically. When working with students doing the data collection by hand, the fewer samples they collect, the less likely they are to 'match' the theoretical probability that is predicted for the outcome. So, tossing a coin, theoretically should yield 50/50 heads/tails. But, if students only toss the coin 10 times, they are more likely to not match the theoretical, and maybe their result shows heads seems to be more occurred more often.
The idea behind the Probability Simulator is that you can start with a small number of
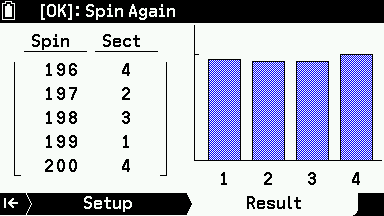
samples, and then build, and go up to 999 data samples of the experiment (which in a classroom situation would be unrealistic time-wise). What students can see as you increase the number of samples is that the theoretical probability becomes more likely, reinforcing the idea that sample size/number of trials has an impact. There are 6 different simulations that you can run with the Probability Simulator - coin toss, dice roll, spinner (spinning to land on 4 possible numbers), marble grab (five different types of marbles), a card draw, and then random numbers. There are multiple settings you can control, such as the number of trials, number of coins, dice, or cards, and more.
What I love is there is a visual of the 'trial' (dice rolling, spinner spinning, etc), as well as a graphical display of the outcome and a table display. Students are provided with multiple representations of the situation which really helps them make connections. The last two options, card draw and random number, don't show a graphical display. Instead, after collecting your data, you have the option to store the data to Statistical Lists. When you then go into the statistical menu, your lists are populated and you can then decide which lists and what types of graphical displays make sense for the data collected. You can actually do that with all the different simulations - store the data and go into the statistical menu and look at different plots, such as box-and-whisker, pie, scatter....whatever might make sense. But the first four auto-show a bar graph along with the table as the simulation is running, which is a great visual.
The video below shows how to use the Probability Simulation menu in the fx-CG100CW using the emulator, which is available to explore at ClassPad.net. As this new school year begins, consider exciting your students with math that first week or two of school by doing some probability simulations and getting them engaged in math!

